Blickshift Analytics is a high end data analytics software for the analysis of complex data. Cutting edge Visual Analytics techniques let you analyze your data in an exploratory way. Using Visual Analytics, we change the way of analyzing user experiments. We open the door to new exciting technologies and future business models. Blickshift Analytics leads to high efficiency and low costs for analyzing large data sets at a high detail level in combination with a profound understanding of human behavior.
What is Visual Analytics?
Often, eye tracking data sets are becoming too vast for manual evaluation, but purely automatic approaches don’t quite do the job either. Visual Analytics combines human intuition and recognition abilities with computer’s number crunching in order to benefit from the best of both worlds. Blickshift Analytics implements this approach with an explorative workflow, resulting in an efficient analysis and transparent and quantitative study results.

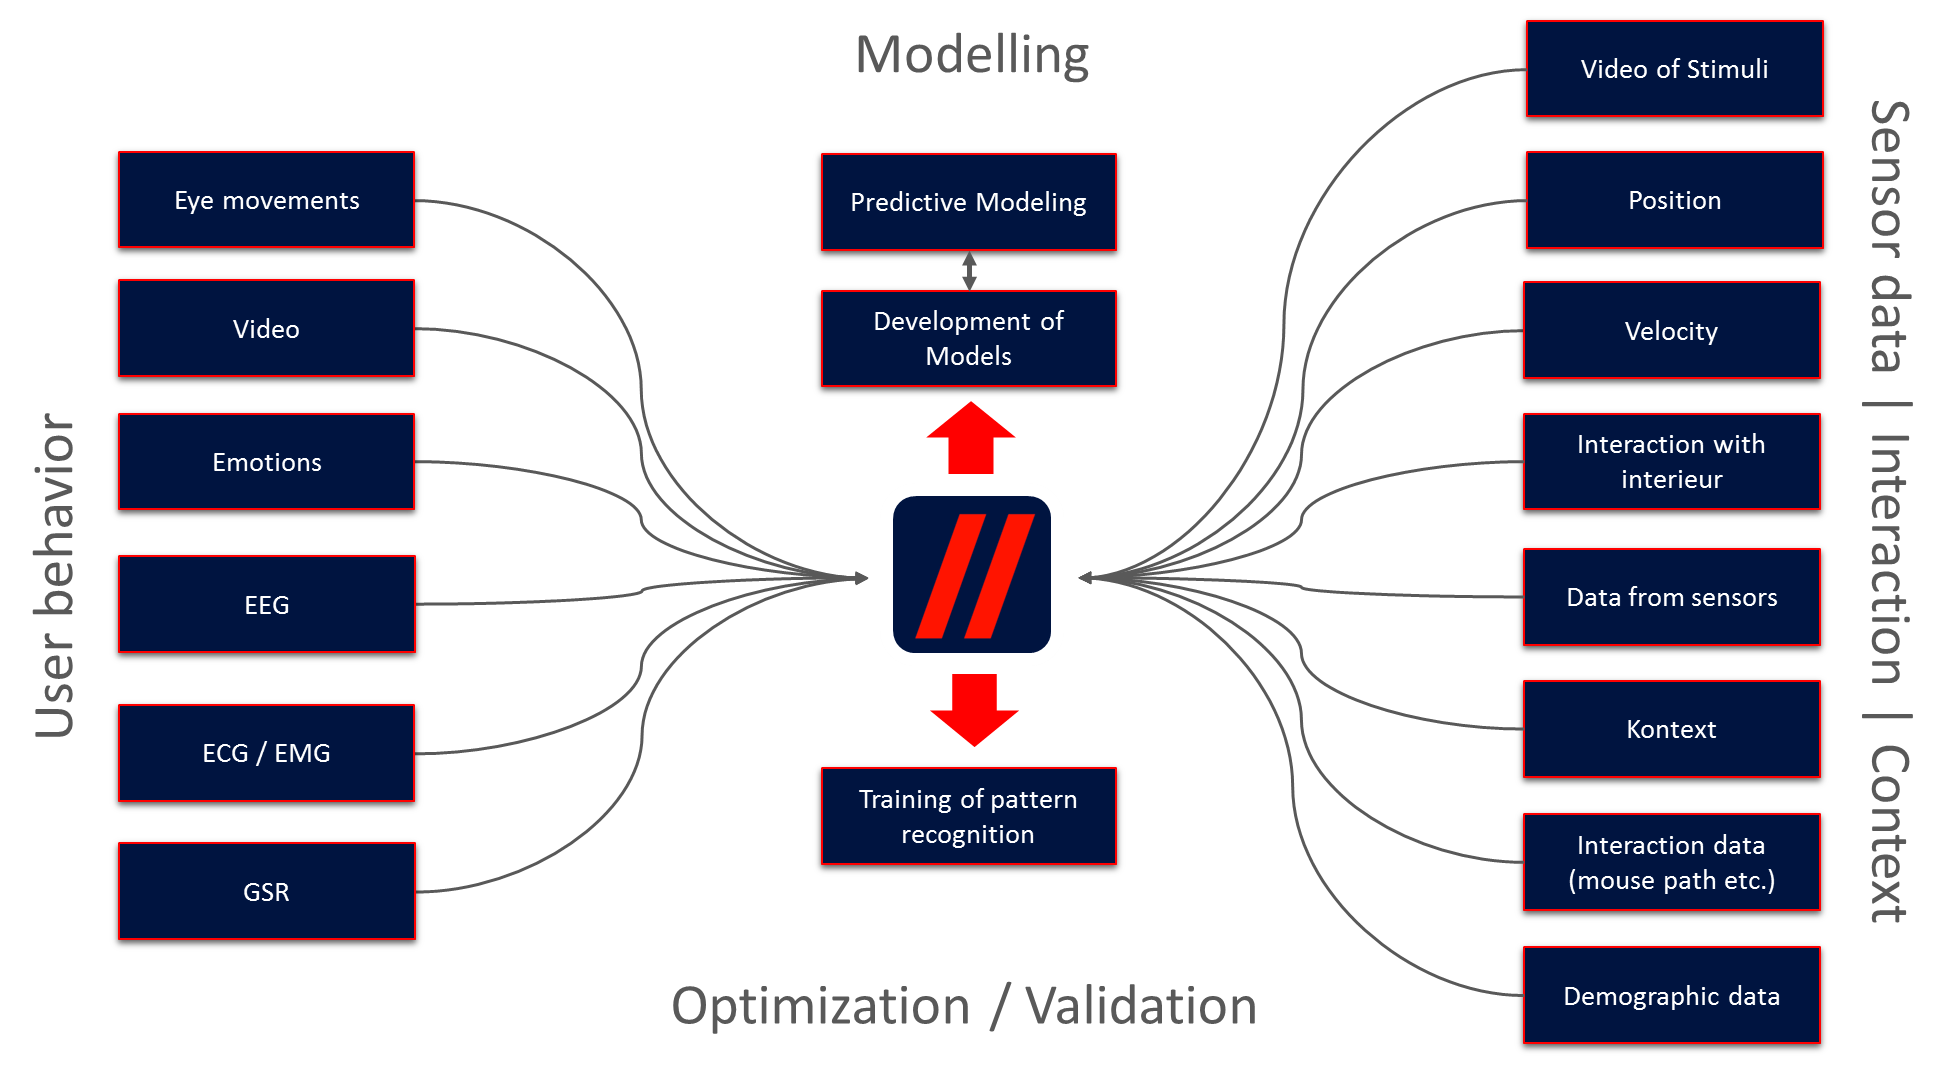
Find correlation between many information channels
With Blickshift Analytics you can find recurring pattern in one data stream or correlations between different data channels. The framework of Blickshift Analytics supports information channels from different sources, from interaction log files and about the context during the recording. All data streams have to be recorded beforehand and can be imported into our software by a flexible import system.